Code Lives More Than Twice as Long Once You Stop Counting Moves as Deaths
A new preprint (arXiv:2611.10530) shows line-survival stats, including ones about AI-written code, flip on three hidden choices: counting moves as deaths, pooling removal with revision, and leaky splits.


If you track how long AI-written code stays unchanged before someone edits it, the number you get has more to do with three decisions most dashboards make without telling you: how a line's end is defined, whether removal and revision count as the same event, and how the data is split when a model is checked. Pavel Gurov's new preprint, Mismeasuring the Life of a Line of Code: Lessons Learned the Hard Way (arXiv:2611.10530, submitted 7 Nov 2026), measures what each of those decisions does to one dataset. It is worth reading closely because six of its ten pitfalls are mistakes Gurov made himself before he caught them.
The corpus is 120 TypeScript repositories on GitHub, with 588,902 commits and 32.5 million line births. Gurov states plainly that several results from his earlier preprint on the same data did not survive these checks and should no longer be cited.
A move is not a death
The first decision is mechanical. Move a function from one file to another, or rename cnt to count, and a plain diff reports deleted lines and new ones, even though nothing left the program. Gurov's matcher found that 8.3 million deleted lines in the corpus actually lived on: 1.8 million had been moved to another file and 6.5 million had been rewritten. Counted as deaths, they would add three false deaths for every four real ones.
That decision sets the headline number. Count moves and rewrites as deaths, and half of all lines in the survival sample are gone within 1.3 years. Follow lines through their rewrites, and the median is 3.0 years. It also flips the sign of a feature: under the correct definition token count protects a line (hazard ratio 0.839), and under the naive one it appears to endanger it (1.124).
You can check this on your own data. Moves come in bulk: in this corpus, two thirds of all moves happened in 0.6% of commits, each moving at least 100 lines. If your deaths spike in refactoring commits, you are probably counting refactors.
Removal and revision are different processes
The second decision matters most for anyone quoting AI-code survival numbers. The paper notes that Rahman and Shihab's study of AI-agent code (arXiv:2601.16809) ends a line at any change git blame attributes to a later commit. Gurov says that definition fits their question, how long agent code stays as written, but not a question about removal.
Table 1 of the paper shows what pooling hides. About a quarter of lines leave with their file or in a bulk edit, which is a decision about a module rather than a line. About a fifth are revised in small, local edits. With one feature set and five definitions of the event, the model ranks lines within a project at 0.54 to 0.57 for "any change," "any deletion," or "removal." For local revision (an edit touching at most 20 lines of the file) it reaches 0.71, and 0.76 when the edit touches at most five lines.
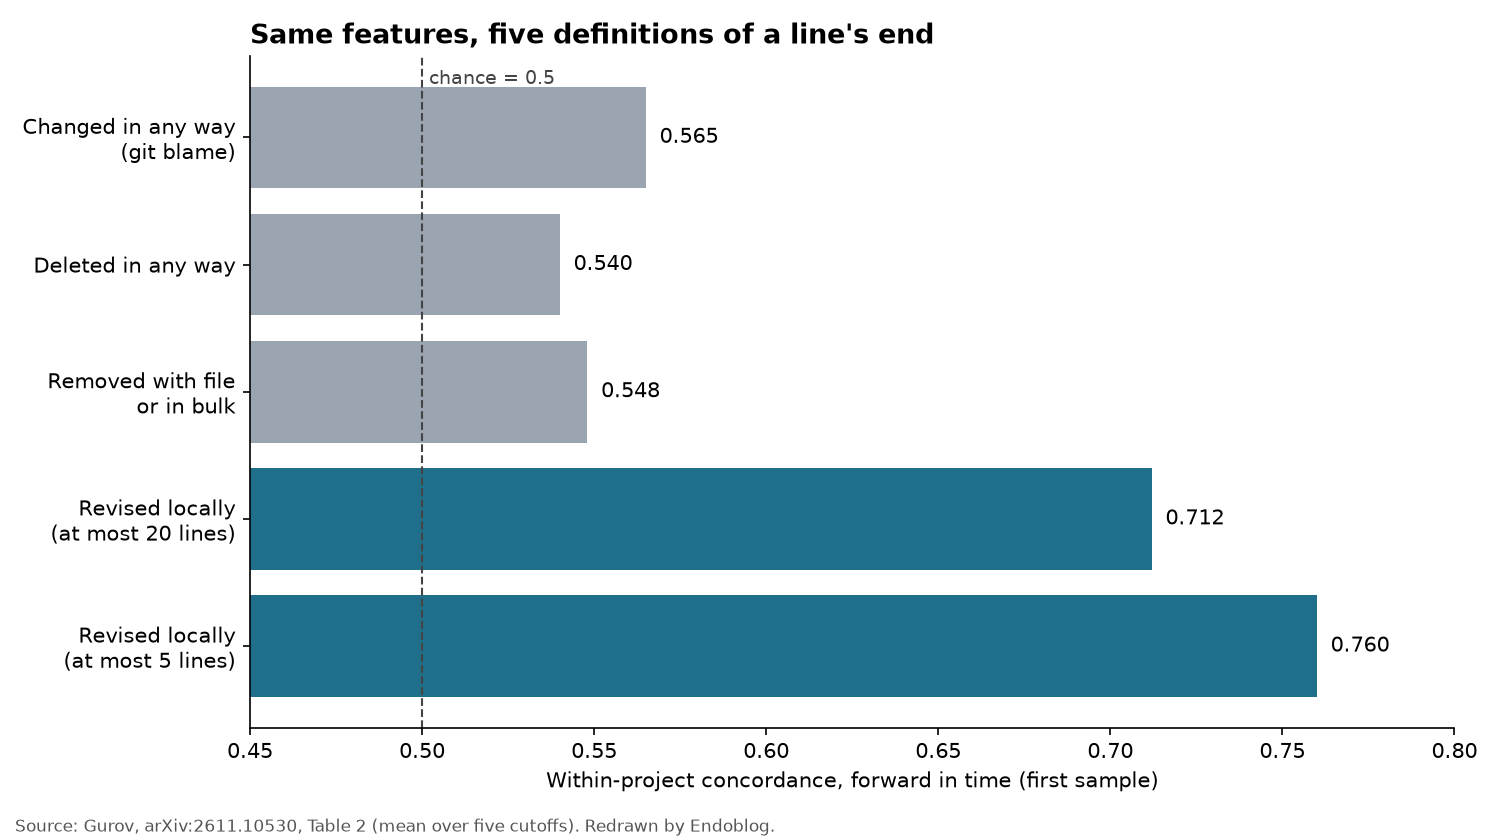
Gurov's earlier models used any deletion as the event, ranked lines at 0.54, and concluded that a line's future can't be predicted from what is known at its birth. That conclusion was wrong. The predictable signal, local revision, was buried under bulk removal, the larger of the two processes.
An AUC of 0.92 that meant nothing
The third decision is evaluation. A classifier predicting death within ninety days, trained and tested on lines from one half-year split by file, reached an AUC of 0.92. Gurov didn't believe it. Keeping the model and lines fixed and changing only the split, removal concordance was 0.83 split by file, about 0.75 split by commit or directory, and 0.72 evaluated forward in time. Every feature was known at birth, so nothing from the future leaked in. What leaked was shared fate: lines added by one commit share their context and much of their outcome, and a file split puts them on both sides.
Statistical significance had the same problem. Clustering standard errors by repository made confidence intervals 2.4 to 19 times as wide as the naive ones. Night-time commits, with a naive p-value below 10^-100, ended up at p = 0.22. With both clustering and a Holm correction, only token count stayed significant for removal.
What a team should do with this
The corrected findings are modest. Removal belongs to modules and projects: of 11.0 million deaths, 45% removed a whole file, and within a project the models could barely rank removal at all. Local revision can be ranked moderately, and most of the signal sits in how a line was born, especially how few lines the birth commit added to the file. Patterns people read as bad practice, such as casts to any, added almost nothing once the birth context was known (0.003).
If you're building a metric for how long Copilot or agent code lasts, the paper's checklist gives you a short audit:
- Match moved and rewritten lines before counting a death, and read a sample of diffs to validate the matcher.
- Tabulate how lines leave before modeling, and treat removal and local revision as separate competing events.
- Evaluate forward in time, within projects, over several cutoffs, and report the spread.
- Cluster standard errors by project, and count projects, not lines, as your sample size.
Gurov also coded 22 published lifetime studies that had open copies. Twenty of the 22 let one event stand for every way an element ends, and of the ten that compared groups with tests treating elements as independent, none clustered. His data is all TypeScript and sampled by popularity, so the size of each pitfall will differ elsewhere, though the paper argues the direction follows from the mechanism. A survival number for AI-written code that doesn't say how it handled moves, pooled events, and splits is mostly a number about those choices.
Scripts and the numerical outputs behind every table and figure are archived on OSF.