RCA Agents With Runbooks Missed the Service That Went Quiet
On a 90-case benchmark, harnesses that let the model choose what to read beat five published root cause analysis agents. The published agents missed a service that simply went quiet.


In the case at the center of this paper, the broken service never emitted an error. It just stopped receiving traffic.
The case is rca100-main-0104 from the RCA-100 chaos-drill collection. In an OpenTelemetry demo shop deployed on Kubernetes, the inventory Service selected no pods. When cart called inventory, the requests failed with "Connection refused (inventory:9090)". Cart's error rate rose from 1.7% to 32.5%, and the frontend raised an alert at a 51% error rate. Inventory went silent. The SQL agent's queries show its span count dropping from about 1,450 per minute to 109 in the first 30 seconds of the fault, and to zero after that.
Tingzhu Bi, Xun Zhang, Jinglin Li, Ping Wang and Meng Ma (Peking University and BUPT) ran this case and 89 others through every root cause analysis (RCA) method they could get working. Their paper, Free to Look, Free to Reason, went up on arXiv on 26 October. The main finding is that three simple harnesses, which let the model choose what data to look at, beat five published LLM agents on microservice RCA. The more interesting part is why the published agents lost, and what that means for anyone writing an incident runbook for an LLM.
The setup
The authors built a benchmark called RCAtlas. They took eight public RCA datasets (2,359 released cases), screened 542 of them, kept the 348 that passed eight exclusion rules, and sampled 90 cases across 23 scenarios. Cases with contradictory labels were dropped, as were cases with more than one fault and cases where neither a judge model nor an automatic check could find the fault in the telemetry. The median random-guess hit rate per case is 3.45%.
They compared three groups of methods:
- Simple harnesses. One-shot gets a single call over a rule-selected evidence package. The SQL agent is a ReAct loop over the raw telemetry in DuckDB, capped at 100 calls. Codex runs the Codex CLI in the case folder and writes its own shell and Python.
- Published LLM agents. FoA, RCAgent, RCA-Agent, DecompRCA and mABC. Two ran from released code; three were reimplemented from their papers.
- Non-LLM methods. NSigma, BARO, CIRCA, RCD, TORAI, FaultInsight and SimpleRCA.
The metric is PR@1, the share of cases where the first answer is the root cause.
The numbers
Averaged over three mid-tier models (GPT-6 Luna, DeepSeek V4.1 Flash and Claude Haiku 5.5), Codex scored 77.2% PR@1 (it wasn't run on Haiku), the SQL agent 72.8% and one-shot 65.3%. The best published agent, FoA, scored 53.3%, followed by RCAgent at 49.3%, RCA-Agent at 43.3%, DecompRCA at 28.5% and mABC at 15.6%. NSigma, a statistical method that scores metrics by how far they deviate, reached 38.9% and beat two of the published LLM agents. A random ranking got 5.5%.
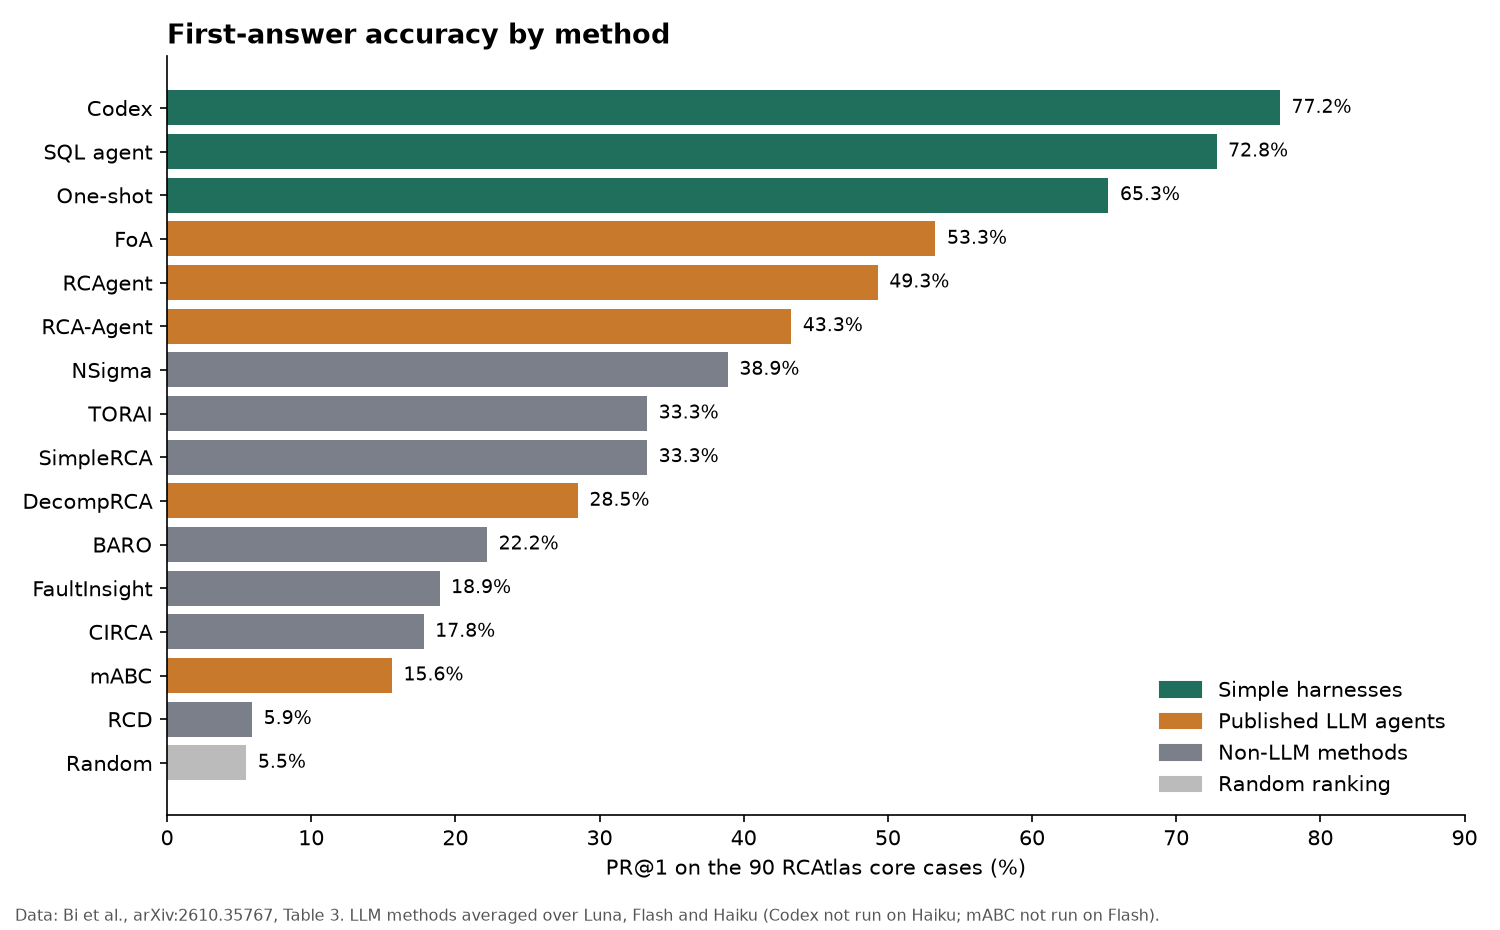
One-shot is a single call over evidence picked by rules, and it still beat the best published agent by 12 points. The authors ran the simple harnesses on six models in total, and on every model where both groups ran, the simple harnesses came out ahead.
Who decides what gets read
The authors track one number for each method: the prescribed-call ratio, the share of model calls the program issues at fixed points instead of the model choosing to make them. For the three simple harnesses it is zero. For the published agents it ranges from at least 0.10 (mABC) through 0.29 (RCA-Agent), 0.35 (RCAgent) and 0.51 (FoA) up to 1.00 (DecompRCA, whose single call sits wherever its program puts it).
Go back to the inventory case and look at where each prescribed method went wrong.
FoA starts by matching the incident to a standard operating procedure (SOP). It was given only the anomalous window, so it labelled the incident "microservice incident" and picked a generic SOP. None of that SOP's fixed steps read logs. After 11 model calls, its judge named cart as the root cause. The log template that gave the answer away, a refusal line that grew from 43 occurrences before the fault to 609 during it, was never read.
mABC starts at the alert and walks down the call chain. In the minute it checked, cart's AddItem was still getting one failing call, and the frontend's other three callees were getting none. Inventory sits three hops down and was never compared. mABC stopped at cart after 32 model calls and 631 seconds. As the authors put it, a method that inspects only the calls a service receives "cannot see a service that stops receiving them."
The statistical methods share the blind spot. NSigma and BARO keep the sign of the deviation, so only metrics that rise score high. Inventory's request count fell sharply, and it ranked second to last among 373 metric columns.
The simple harnesses solved the case with no RCA logic built in. Codex wrote one script comparing every entity and metric before and during the fault. Cart's error rate came out on top, with the refusal line already in the output. Then it read the logs around the onset, which showed inventory serving until 01:59:22 and cart being refused from 01:59:23. That took 7 commands, 8 model calls and 57 seconds. The SQL agent counted failing spans by service, searched the logs for failures, found 1,291 refusal lines, checked inventory's request rate over time, and submitted inventory after 31 queries.
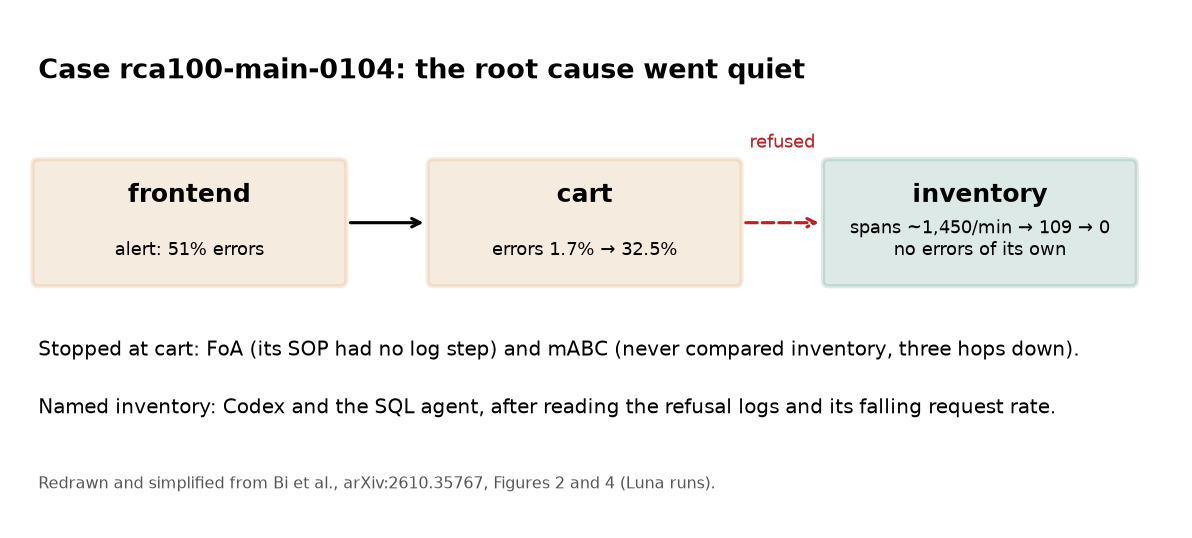
Every prescribed method in this case was looking for something that got worse. The real fault was a service that went quiet. A hand-written procedure encodes what its author expected an incident to look like, and a fault that shows up as missing traffic doesn't fit that picture.
Reasoning effort mostly adds time
Raising reasoning effort barely helped. Going from medium to max on Luna, or medium to xhigh on Sol, added 2 to 4 points of PR@1 for the SQL agent and Codex, at 1.5 to 4 times the wall time. A stronger model mattered much more: moving from Luna to Sol added 14 to 18 points, and the agents made fewer calls and queried fewer entities along the way.
Stronger models were also steadier. Across three passes, the share of cases solved in some passes but not all fell from 32–36% on Luna to 7–8% on Sol. Three Codex passes on Luna scored 62%, 69% and 76%. If you compare two RCA methods with a single run on a weak model, you may be measuring noise.
On cost, the authors only count runs that beat NSigma. Every run on the cost and time Pareto frontiers used a simple harness. Luna with Codex reached 68.9% for under a cent per case. Flash with Codex reached 85.6% for about five cents. Sol with the SQL agent reached 85.6% in 45 seconds. The top run, Sol at xhigh with Codex, hit 88.9% for about 26 cents and 277 seconds per case.
What the paper doesn't show
The authors are careful about their limits, so I'll repeat them. The prescribed-call ratio measures how much of an investigation is fixed in code. It doesn't prove the fixing is what lowers accuracy, and within the published agents the ratio doesn't even order the results: RCA-Agent prescribes fewer calls than FoA and still scores lower. They say an ablation that lifts the prescriptions from one agent would test the causal claim directly. Three of the five published agents are reimplementations, and the faults come from public benchmarks and drills, not anyone's production on-call.
They also say this doesn't make domain knowledge useless. Their conclusion is that "fixing it into the control flow hurts when a procedure does not fit the case." The next step they propose is offering procedures to the model as optional guidance instead of prescribing them.
That's a usable design rule. If you're putting an LLM into incident response, hand it the runbook as a document it can read, give it direct query access to metrics, traces and logs, and don't let the runbook decide which data it's allowed to look at. Then test it on an incident where the culprit simply goes quiet, because that is where the hand-written procedures in this paper failed.